Hello Investors & Traders,
At Dhan, we believe that great investment decisions are built on great research. That’s why
we created ScanX — to bring together everything a trader or investor needs to study
markets, companies, and insights from a single, seamless interface. Whether you’re
scanning for stock ideas, exploring financials, or analysing institutional activity, ScanX brings
you deeper, data-backed visibility all in one place.
When researching a company, it’s essential to evaluate both its fundamentals and market
behaviour. Traders look at demand–supply dynamics, technical setups, and price action.
Investors dive deep into ratios, financials, ownership patterns, and analyst outlooks. Usually,
you have to toggle between multiple sources to get this information.
As a result, Company Information is something investors and traders refer to frequently to
track updates, review recent financials, check ratios, and assess the overall health of a
company. And there’s always more to explore: how funds are viewing the stock, what
analysts are saying, and most importantly, whether your investment thesis is still on track.
While building ScanX, we focused on creating a research experience that’s intuitive, useful,
and built around you. That’s why, from Day 1, we brought technical and fundamental data
together on a single page - allowing users to evaluate both price and value without hopping
platforms. A trader can check company fundamentals, preferred ratios, and technical
indicator values at once, making the research process faster and more efficient.
Over time, we’ve added much more depth to the company research page, enabling you to
analyse businesses at a more granular level. This includes Mutual Fund data highlighting
which funds are buying, selling, or holding large positions.
But that’s not all. As always at Dhan, we continue to push the limits of our products
making them better, simpler, and more useful for every user. And that’s why we’ve now
upgraded the company research experience on ScanX even further.
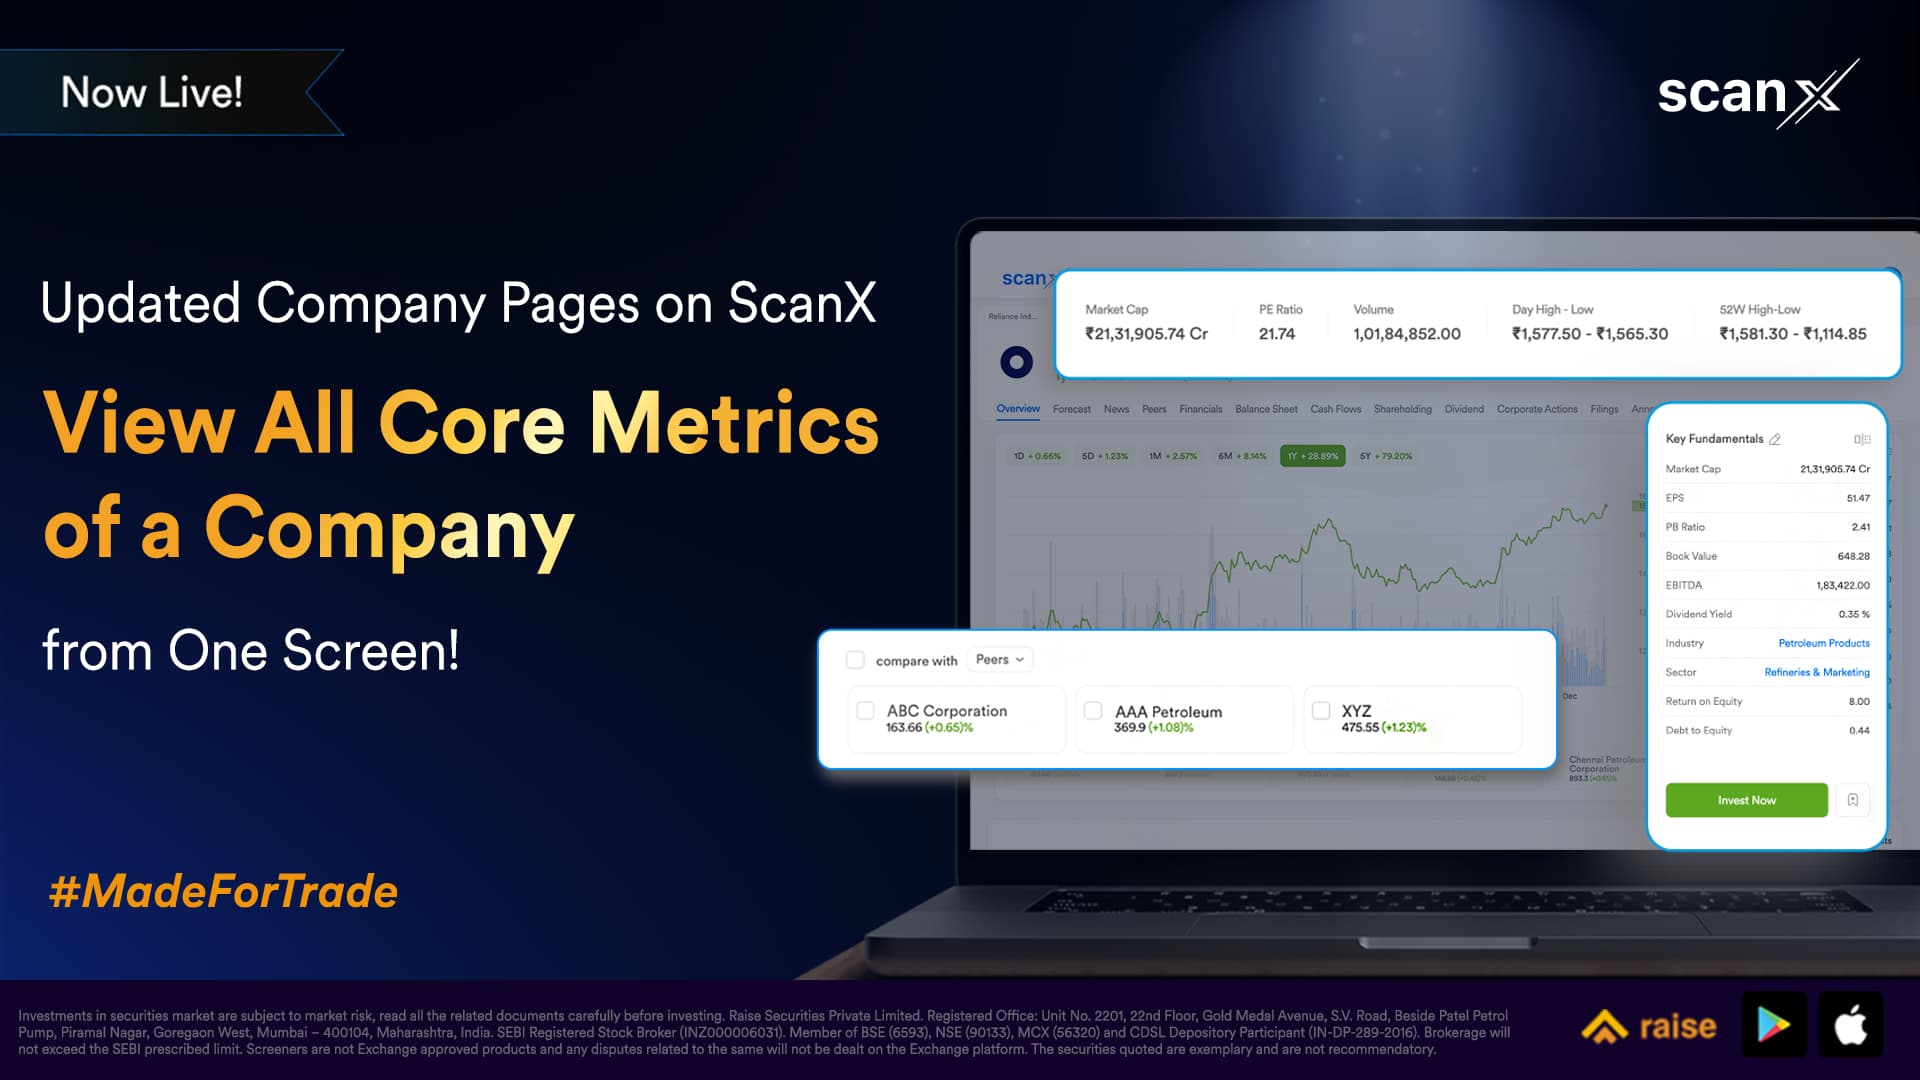
There’s now a new way to track a company’s core metrics — right at the top. As soon as you
open any company page, you’ll see key metrics upfront, followed by the next set of ratios
and data points you want to explore.
We’ve also introduced a new way to compare a stock’s performance with its industry, as well
as with other stocks or indices — directly from the company page. With just a few clicks, you
can get a comparative view without leaving your research flow.
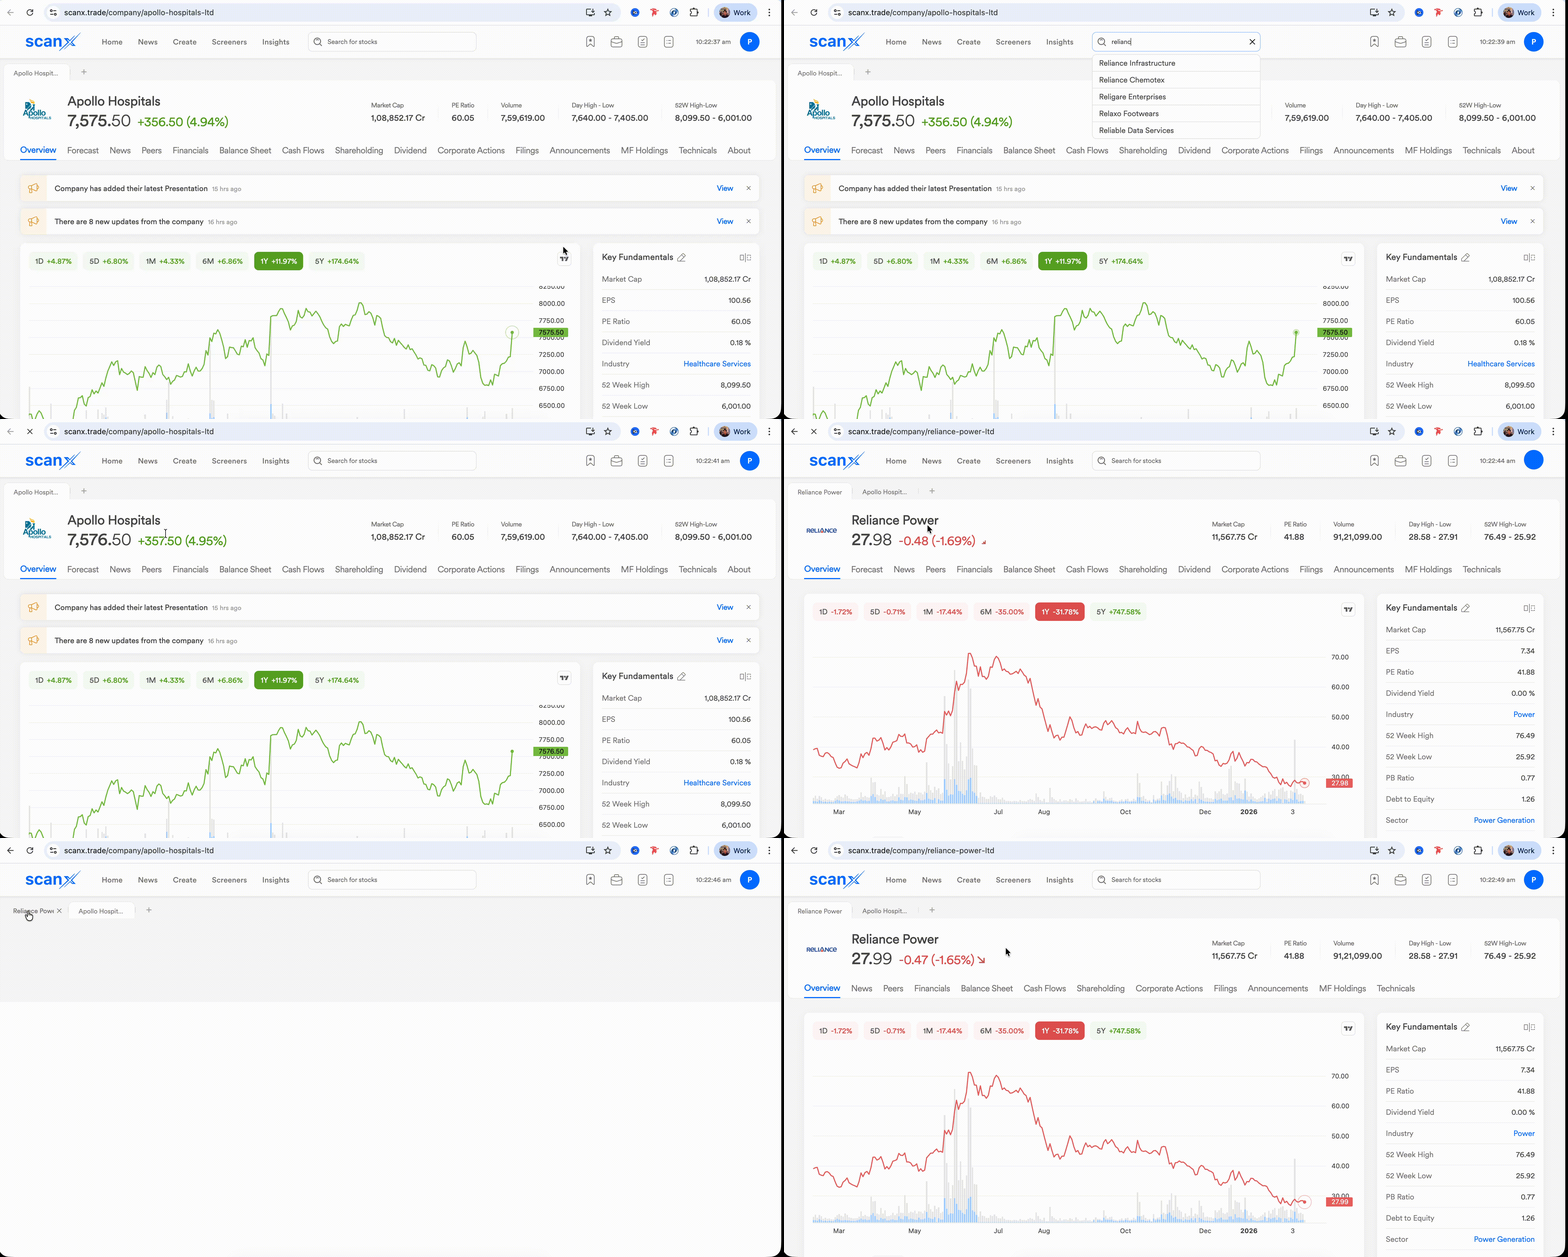
To further improve usability, we’ve enhanced the UX with something we call Tab View.
We’re all used to opening multiple browser tabs while researching but it becomes frustrating
when those tabs are all from the same platform, just showing different companies or data.
That’s where Tab View in Company Research comes in.
With a single browser tab, you can keep track of all the companies you’re researching —
decluttering your browser and helping you stay focused on what matters most: analysis.
While financials are critical, many leading indicators often appear first in the news — and
these are easy to miss. To solve this, we’ve added ScanX News directly on the company
page. This is the same news experience we’ve refined over months, covering almost every
listed stock and every major corporate action.
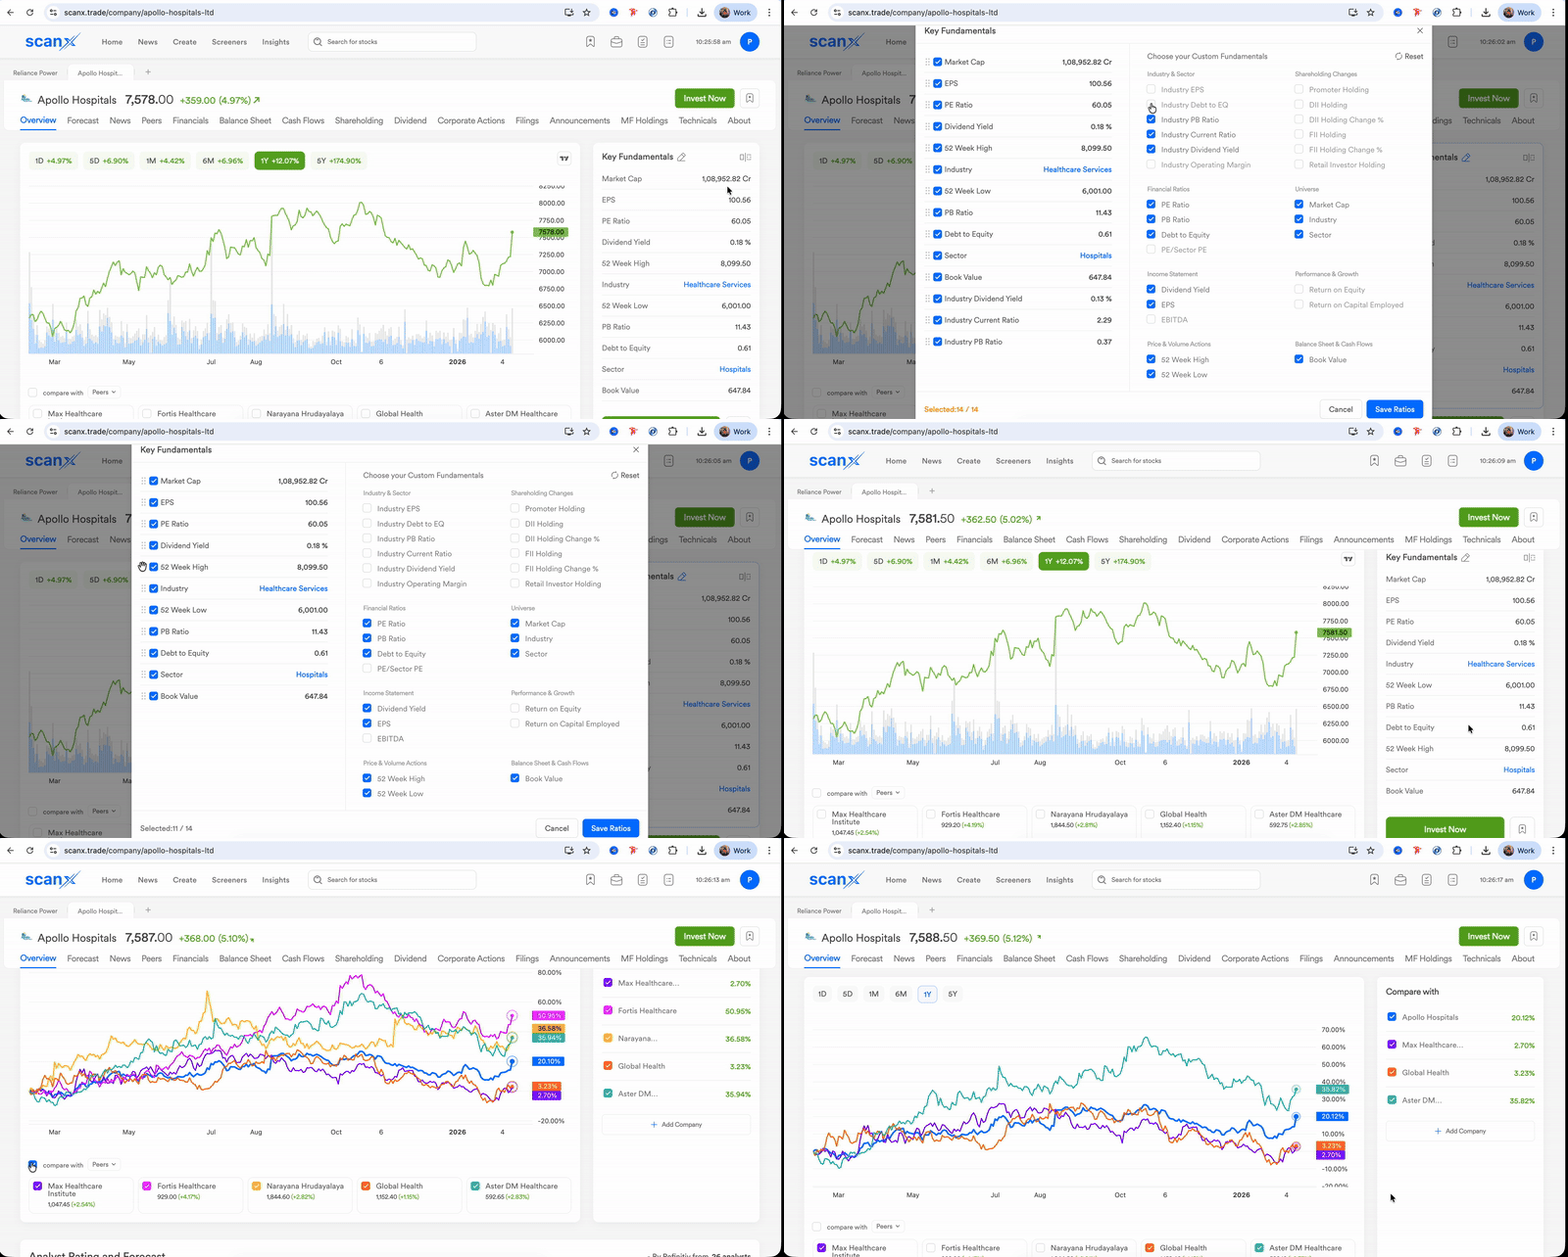
We’ve also enhanced how you work with rows and columns of data. You can now visualise
metrics the way you want track them across timeframes and compare them seamlessly.
A company’s most important business metrics and disclosures are made public through
exchange filings. We filter and process this information for you and present it directly on the
ScanX company research page fetched in real time, so you always have access to the
latest data.
And there’s still more that we’ve worked on across the ScanX company research experience
improvements you’ll discover as you explore it yourself. As always, there’s much more to
come.
Until then, we’d love to hear your feedback on how you want your research experience on
ScanX to evolve.
Thank you,
Hardik