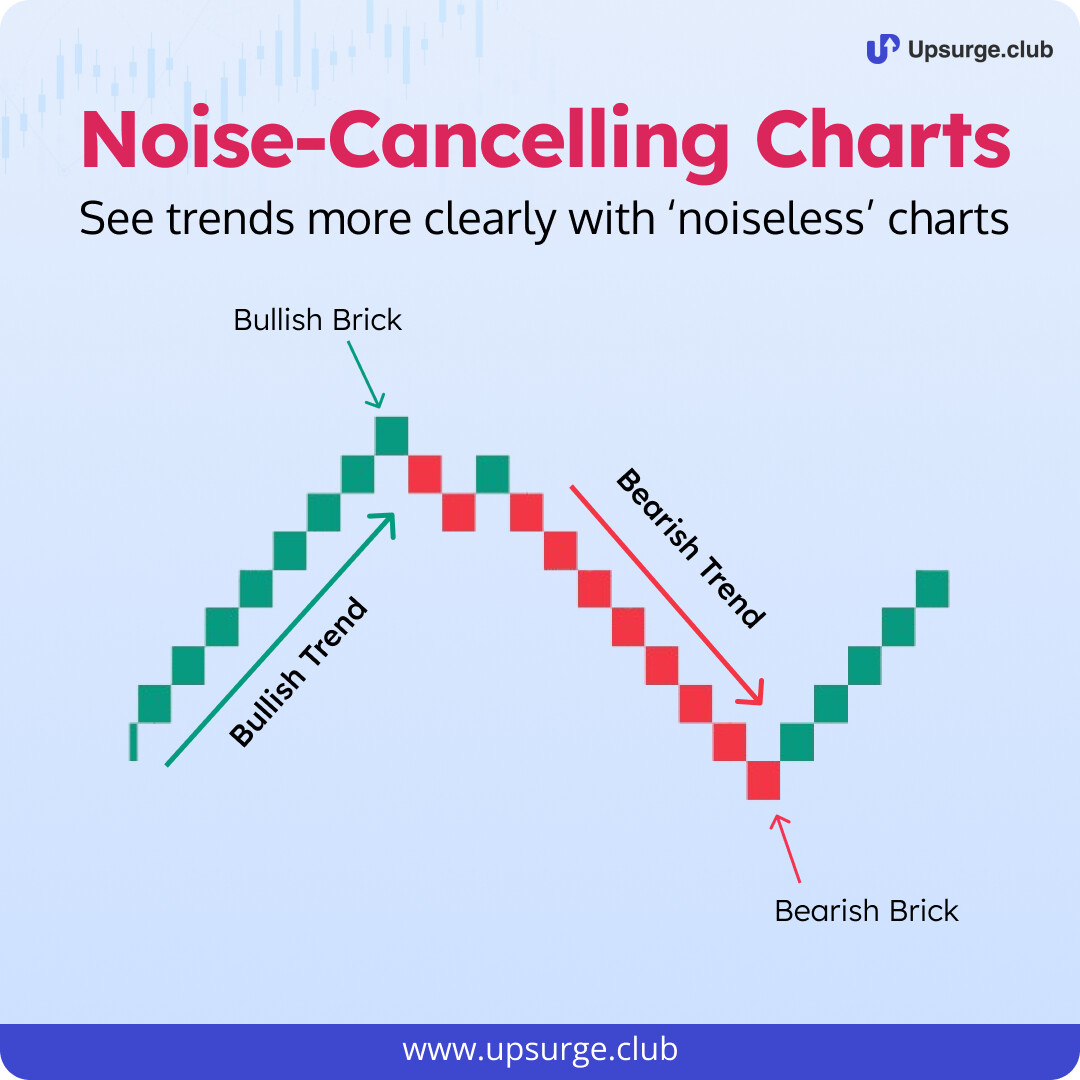
Typical candlestick charts convey detailed information about a stock’s price movement over time.
But more often than not, small corrections, volatility, and false signals make it difficult to identify a trend ![]()
The good news is that there’s a way to look at price movements without the ‘noise’ - say hi to Renko charts!
Learn about Renko charts & how to interpret them in our latest newsletter issue ![]()
Join 4000+ people getting such insights delivered to their inbox daily by signing up for Upsurge’s Newsletter